Winners and losers in the funding formula [update 3]
Have posted the data from RIDE's proposed funding formula to a Google Docs spreadsheet, and what jumps out at me is the number of East Bay communities taking double-digit hits.
Update: I did a quick sum, and East Bay towns would lose $18.M in state funding. With the exception of Barrington, which gets an extra $3.7M.
Karen suggested another Future Search — but instead of getting a group together to envision the innovative possibilities for our schools, we'll need to plan for the grim scenario of cutting $260K worth of programs every year, until, 10 years out, we are operating a system with $2.6M less than today.
And I'm with Maddie, who commented on a previous post: Barrington gets a 189% increase. WTF?
Update: Newport Now has a description of the hit Island-wide.
Update 2: Added a column from the State's 2010 Fiscal Stress Test that shows the financial health of each municipality — scores over 4 are more stressed. If Tiverton has the highest level in the East Bay at 3.35, it makes no sense to cut their state contribution by 26%. Or Portsmouth, for that matter, at 2.86 cut by 47%. Barrington, at a comparatively balmy stress level of 1.89 sees a 190% increase.
And while the RIDE report does show the formula by which state share is calculated:
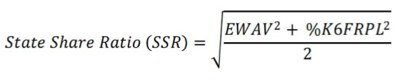
It does not provide any backup data (or even pointers to find) the EWAV data (Equalized Weighted Assessed Property Value) on which it is based. RIDE does provide the K-6 Free and Reduced Price Lunch numbers, used as a proxy for economic hardship, and I have added those to a column in the spreadsheet as well.
Update 3: Thanks to an anonymous reader, here's the link to the EWAV data on RI Municipal Finance, and I've added it to the GoogleDocs spreadsheet. Unfortunately, I still can't see how you plug this into the equation — the presentation describes the EWAV value as "a number between 0 and 1 based on each district's assessed real estate values and a media income value." Any ideas?
Resources:
Fiscal Stress and Financial Condition of RI Cities and Towns (pdf) from the Dept. of Municipal Finance
EWAV data from RI Municipal Finance
Comments
Portsmouth Citizen
Sun, 02/28/2010 - 12:54pm
Permalink
Education Funding Formula for EWAV data
I'm not a math major, but it doesn't take an advanced degree of any kind to figure out what EWAV2 is.
If one is presented a mathematical formula, and then provided a key to understanding all the elements EXCEPT ONE, there are only two possible choices: either (1) it was an oversight or (2) it was intentionally left out. I don't give the benefit of the doubt when it comes to the government, so I don't believe it was an oversight. Backup for the EWAV2 data was, I believe, deliberately left out to hide something.
And, what Gist is hiding is obvious. It is her own personal value judgment about how much a community should be paying. It is a typical "fudge factor" that bureaucrats throw into formulas so that they can adjust outcomes according to their whim.
In short, EWAV is not an acronym, but a neologism meaning "Shut up and pay what I say. I'm the Education Commissioner and what I say goes."