The RIDE funding formula for Portsmouth, explained
Alert reader davidc (THANKS!) pointed out that RIDE has posted backup documents to a new education funding formula page here, and I'm happy to report that we now have enough information to calculate the state share (I've updated the GoogleDocs spreadsheet with this info, and will be using references to that worksheet as I go through the explanation below.
But first, a couple of comments. Although I had sent an e-mail to Deputy Commissioner David Abbott (cc'ing Commissioner GIst) asking for the information, they did not have the courtesy of replying to let me know this had been posted. And while I don't know when the page went live, forensic examination of the supporting data PDF shows that it was created Thursday morning. (Line 1513 for those geeks playing along at home: /CreationDate(D:20100304155512Z)/Author(Beardsley, Andrew)/Creator(MicrosoftÆ Office Word 2007)/Producer(MicrosoftÆ Office Word 2007)/ModDate(D:20100304113952-05'00')
Second, I can't help but point out the glaring error in their document. On page 2, the total adjusted assessed value state-wide is this:
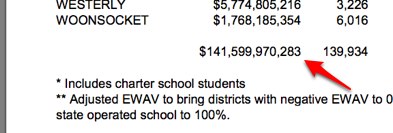
But on the following page, this is the number given:
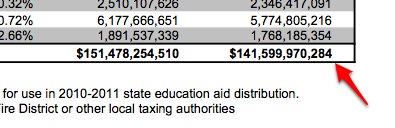
Now I know that a single digit off on a hundred-billion-dollar number is insignificant. But if my son handed that in to his math teacher, Mrs. Warner, she'd circle it, and with good reason. If you want people to trust your math, getting the little things right — like having the same number on two successive pages — is kind of important. I mean, really. What would Arne Duncan say.
Third, and this is a subtle methodological point, but I question the amount of rounding that occurs in the RIDE calculations. Because both the percentage of students on Free and Reduced-Price Lunch (FRPL) and the Student Share Ratio for the Community (SSRC) get squared in the formula, small changes get magnified. They also appear to have rounded the final State Share number. I've included columns in the spreadsheet indicating the differences between calculated values and RIDE's rounding. It's mostly in the tenths-of-a-percent, but when we're talking about allocating taxpayer dollars, it doesn't cost RIDE any extra to use a couple of decimal places.
At a high level, the formula is fairly straightforward. RIDE's consultant at Brown developed a "core instructional amount" based on an average of four New England states (RI, MA, CT, and NH). This value, $8,295, includes instructional costs designated by the Basic Education Program (BEP). It does NOT, however, represent the cost of actually educating students, since RIDE acknowledges that it does not include teacher retirement, group home aid, food service, transportation, safety, building upkeep, utilities, maintenance, debt service, capital projects, out of district tuition and transportation, and non-public textbooks.
In other words, this number represents only some theoretical ideal, not the actual cost of opening the doors of a school building. Let's just be very clear on that.
Now, let's see how much of this number RIDE considers the state should be providing. To get there, we need to multiply $8,295 by the number of students in the district, which is referred to as the Resident Average Daily Membership (RADM). To that number, we need to add an adjustment for the number of students in the district who are receiving Free or Reduced-Price Lunch (FRPL) which RIDE is using as a proxy for the percentage of the population who are economically challenged. RIDE assumes that these students will need extra help, so they add a factor of 40% of the core $8295 for each FRPL student.
So the total amount the district "should" be spending is RADM * 8,295 + (FRPL * (8,295 *.4))
If we put in the numbers for Portsmouth, with a RADM of 2,657, we get a result of $22,879,269. The obvious question — how to reconcile this with our current school budget of $35,746,286 — does not seem to enter into RIDE's calculations. They are not talking about the cost of putting the teacher in front of a room that has heat, light, and buses to get the kid there. But wait, it gets better.
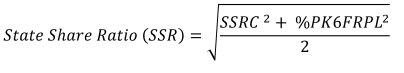
The heart of the state funding formula is a quadratic mean, which weights the community's ability to pay (the State Share Ratio for the Community, or SSRC) and the percentage of students on FRPL.
To get the value to plug into SSRC, we need to do some further math with a number called the Equalized Weighted Assessed Valuation, or EWAV, divided by the number of students in the district.
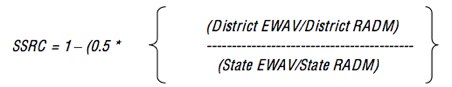
So for Portsmouth, SSRC = 1-(0.5 * ($4,549,808,726/2,657)/(141,599,970,284/139,934) or 15.39% (That's cell S40 in the spreadsheet, RIDE rounds this.) Now, we plug that into the quadratic mean. Since Portsmouth has 1,270 K-6 students of which 122 receive FRPL, our percentage is 9.61 (another one of the things that RIDE rounds).
Therefore, state share equals the square root of (15.39^2 + 9.61^2 / 2) or 12.98% (cell U40).
Now, we can use that percentage, with the "core" cost and we'll find that the state would contribute $2,968,986. I won't make you do the math: that means local taxpayers need to pony up $32,777,300.
So you take a hypothetical number (which acknowledges that it does not represent the full cost of educating a child) and then jump through a series of mathematical hoops, rounding here and there, and come up with a percentage that bears no relationship with the actual per-pupil costs in a district. I hope that RIDE can forgive me if I seem unconvinced of the "fairness" of this.
Note: A reader suggested calculating the percentage of the total cost the state would be picking up: 9.06%.
Comments
John McDaid
Sun, 03/07/2010 - 6:02pm
Permalink
Comment from anonymous e-mail
It should be noted that while the formula does not include teacher retirement, that's due to the fact that pension is paid for separately at a fixed rate by the state and is not different from community to community. By law, the state pays 40% of pension for all state employees, so it doesn't make sense to include the pension money at 100% (or any percent) and then throw it into a redistributive formula.
I'd also like to see some commentary on the fact that the amount of money that the Aquidneck Island districts are losing is less than the amount they can save according to a RIPEC report on reigionalization [right-click to download --ed] ($12.3M in savings, if you haven't read it ). Maybe the state has correctly identified overspending due to inefficiency that exist purely because of lack of will.
Though I understand your searching to understand Portsmouth, why does this treatment (which seems inadequate and unfair to you) not get examined from the perspective of a district that stands to substantially gain due to this formula? When districts are placed on the same playing field (even if it's an incomplete/unfair one), the gap between districts is astounding and frightening about the status quo. No one seems to be telling that story. If the formula is unfair for Portsmouth, what does that say about Barrington's situation right now?
John McDaid
Sun, 03/07/2010 - 6:35pm
Permalink
Response
Hi, anonymous...
Thanks very much for your thoughtful post. A few comments. I noted that the study does not include teacher retirement because RIDE themselves list that as not included. While I take your point about separate state funding streams, my observation is that the $8,295 number does not truly capture the cost of putting a kid in a classroom, and your comment does not alter that fact.
About the RIPEC regionalization report, yes, I have read it (since you may be a newcomer here, I also covered it previously). And a couple of things I would like to note about the document.
First and foremost, this is an economic analysis. By RIPEC's own admission, they did not look at the impact on educational quality that consolidation would have. So, at best, this is only half the story (and, to my mind, the less important half, since any discussion about dollars without tying them to educational performance does a disservice to the community by potentially implying false economies.)
And second, look at the chart below. Click on it for a bigger view, or look on page 94 if you have the report in front of you. See those green bars? That's the BEST CASE scenario. Notice how the savings, even in a full regionalization model, decrease year on year? What happens in 2019? You've already regionalized, so there are no savings left to capture, aren't the numbers are going to cross back into negative territory? Are we really solving anything long term? Why didn't RIPEC run the numbers out over the long run.
Just as likely as "correctly identifying overspending due to inefficiency," is my assertion that the state pulled the $8,295 number out of their hat. If you want to identify inefficiency, you study RI districts and analyze costs relative to neighbors using a true apples-to-apples comparison, and you provide some more helpful suggestions (i.e., if you're going to include NH as a comp, tell us WHY they are able to achieve the cost per pupil.)
And finally, anonymous, this is a hyperlocal site focused on Portsmouth. There are plenty of boosters for this funding formula (including the Providence Journal), so your assertion that "no one seems to be telling that story" is a bit disingenuous.
I agree completely that there are inequities in the current system, and I share your sense of shame at the status quo. And I am absolutely in agreement that we need a fair and transparent funding formula. But this is not it.
Best,
-j
Portsmouth Citizen
Mon, 03/08/2010 - 12:12pm
Permalink
Another response to Anonymous re Regionalization
Dear Anonymous:
I've read the RIPEC report too. Here's the calculus: Take really inefficient systems (primarily Newport but also Middletown) combine them together for savings and add in a really efficient system (Portsmouth is efficient according to independent Berkshire Auditors), then divide the savings out across the 3 communities and guess what happens? Middletown and Newport taxpayers SAVE money while Portsmouth taxpayers LOSE money.
It's all in black and white in the RIPEC report on page 7 in Table I-3. Portsmouth's per-pupil costs are at least $2000 more under any of the proposed regionalization models analyzed that they would be if Portsmouth did not regionalize. (sorry I don't know how to insert the graphic here).
So when you wrote that, "Maybe the state has correctly identified overspending due to inefficiency that exist purely because of lack of will", I simply have to disagree. It's not about a "lack of will", it's about a lack of demonstration that regionalization will financially benefit Portsmouth. It won't, according to RIPEC's report.
John McDaid
Mon, 03/08/2010 - 12:17pm
Permalink
RIPEC chart
Hi, Portsmouth Citizen...
Thanks for pointing that out. This is the chart from the RIPEC report showing how per-pupil costs would increase:
Best Regards.
-j
davidc
Sun, 03/07/2010 - 9:15pm
Permalink
big picture view
Rather than focus on how any particular town gets screwed by the changes, I'm trying to understand how to characterize the towns benefiting and being hurt by the changes. I guess I need data over many years to understand, but the shift from south/east to north/west in the state is pretty amazing to me.
While I would have guessed that the major cities would benefit from a formula, the increased funding for suburban towns to the north and the huge decreases for nearly every south county and aquidneck island district threw me for a huge loop.
John McDaid
Mon, 03/08/2010 - 10:24am
Permalink
Geographic shifts
Hi, davidc...
Good suggestion -- I've added columns to the GoogleDocs spreadsheet with historical student populations from 1998 to look at the change over time. You can see some shifts make sense where increases in funding match increases in student population, but that is not a universal relationship
And I know this is a narrow perspective, but Portsmouth only shrank by 4% but we would see a 47% cut in funding.
Best,
-j